

The 5 Housing Numbers Every Phoenix Homeowner Should Watch
Most homeowners do not need to know everything about the housing market. They just want answers to questions like:
- If I listed today, would my home sell quickly?
- Would buyers expect me to negotiate?
- Are prices still holding up in my neighborhood?
- Should I wait until next year?
The good news is you do not need to watch the market every day to answer those questions.
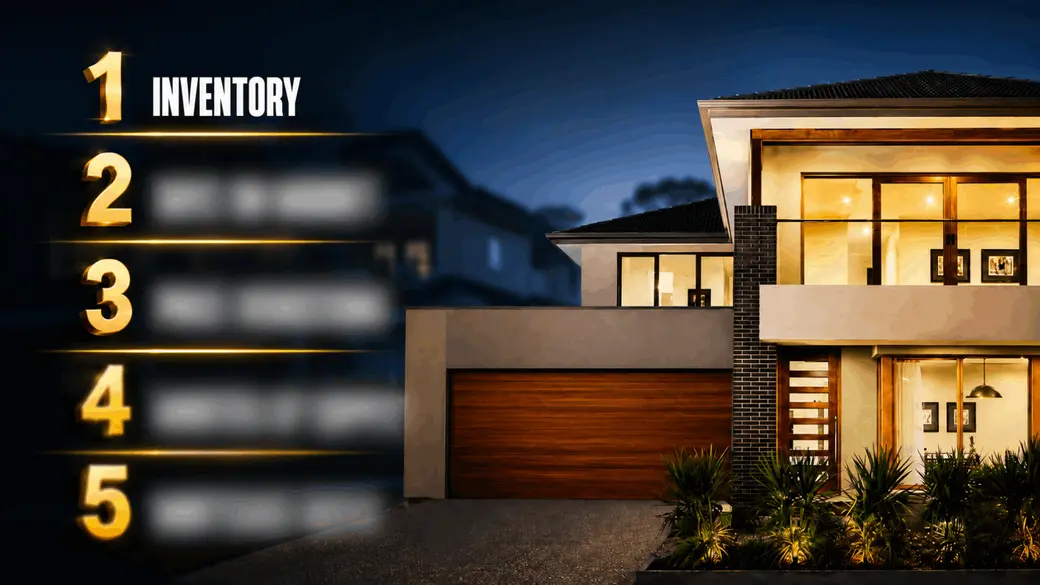
Five local metrics tell most of the story. Together, they reveal how competitive the market is, how buyers are behaving, and what that means for homeowners across the Valley, from Phoenix and Scottsdale to Chandler, Gilbert, Peoria, and Buckeye.
Here are the five data points I track regularly, and why each one matters.
1. Inventory: What's for Sale Near You
Inventory is the total number of homes for sale in your area right now.
That one number tells you who holds the power in a negotiation.
Low inventory means fewer choices for buyers, which means more competition for your home if you list. High inventory means buyers have options, and you have to work harder to stand out.
So here is the question you need a clear answer to:
Is inventory in your neighborhood going up, down, or holding steady compared to last year?
If it is rising, pricing strategy starts to matter more, because buyers have more to compare your home against. If it is falling, competition among sellers is easing, and well-prepared homes get noticed faster.
Here is what I am seeing in the Phoenix area:
- Active listings across Greater Phoenix: about 24,100 (ARMLS, June 2026)
- Compared to one year ago: down about 5% (roughly 25,500 last June)
That is a meaningful shift. After two years of steadily rising inventory, the number of homes for sale in the Valley is actually shrinking. Buyers still have plenty to choose from, but the trend has turned.
2. Days on Market: How Fast Homes Are Actually Selling
Days on market measures how long homes sit before going under contract. Think of it as the market's report card on pricing.
A home that sits too long starts to carry a stigma. Buyers wonder what is wrong with it. The longer it sits, the more leverage shifts to the buyer's side of the table.
Here is the question to ask:
Are homes in your price range and neighborhood selling in days, or in weeks?
If days on market is climbing, the market is telling sellers something about price. If it is holding steady or shortening, well-priced homes are still moving. Knowing which category your home falls into before you list changes how you should approach pricing from day one.
Here is what I am seeing in the Phoenix area:
- Median days on market: 64 days (Phoenix metro, June 2026, Realtor.com data)
- Compared to one year ago: essentially flat (65 days last June)
Two months on market sounds slow if you remember 2021, but it is close to how a normal, balanced Phoenix market behaves. The homes selling fastest right now are the ones priced accurately and prepared well before they hit the MLS.
3. Price Reductions: What Buyers Are Pushing Back On
This is the percentage of active listings that have dropped their asking price at least once. It is a lagging indicator, meaning it tells you what already happened to homes listed for sale.
A high rate of price reductions in your area means buyers are pushing back, and aspirational pricing is getting punished.
So here is the question:
What percentage of homes near you have had a price cut recently?
A high number means the market is correcting overpricing, and the right response is pricing accurately from day one. Homes priced correctly from the start tend to sell well and sell fast. Homes that get chased down in price usually take longer and net less in the end.
Here is what I am seeing in the Phoenix area:
- Share of active listings that took a price reduction in June: about 50% (roughly 9,500 of 18,700 metro listings, Realtor.com data)
- Compared to one year ago: down from about 56%
Phoenix has been one of the most reduction-heavy markets in the country, so this number is worth respecting. Half of sellers are still having to adjust. But the share is falling, which tells me pricing is slowly getting more realistic and buyers are meeting sellers closer to the middle.
4. Months of Supply: The Number That Tells You Whose Market It Is
Months of supply measures how long it would take to sell every home currently on the market if no new listings came on. It is the clearest single signal of market balance available.
- Under 3 months: seller's market
- 3 to 6 months: balanced market
- Over 6 months: buyer's market
Here is what you need to know:
Where does your local market sit right now, and which direction is it trending?
This number can move quickly, and homeowners who understand the movement price and time their move accordingly. The ones who do not are often the ones taking price cuts later.
Here is what I am seeing in the Phoenix area:
- Months of supply: roughly 3.4 months (based on ARMLS June 2026 active listings and monthly sales)
- Compared to one year ago: down from roughly 3.9 months
Greater Phoenix is sitting in balanced territory, and it is drifting toward the tighter end rather than the looser end. June sales came in about 8% higher than last year, under-contract listings have now risen year over year for 12 straight months, and asking-price declines have narrowed to the 2 to 3% range. Demand is firming up while supply eases. That is what a market in transition looks like.
5. Mortgage Rates: The Number That Affects You Too
Mortgage rates affect sellers just as much as buyers. Every point rates move changes how many qualified buyers can afford your home at your target price.
A buyer who could afford your home at 6.5% may not qualify at 7.5%. That directly affects your pool of potential buyers before your home even hits the market.
Here is the question that deserves a clear answer:
At today's rate, how many buyers in your market can realistically afford a home at your price point?
Rates also affect your next move. If you have a 3% rate locked in, deciding to sell is not just about what your home is worth. It is about what payment you would be moving into. That math is worth walking through with real numbers before you decide anything.
As of late July 2026, the average 30-year fixed rate sits at 6.77%, almost exactly where it was one year ago at 6.75%. Rates have spent a full year in the mid-to-high 6s, and buyers in the Valley have adjusted to that reality. The buyers in the market today are serious, qualified, and shopping on value.
What This Means for Phoenix Homeowners
Put the five numbers together and the picture is clearer than any headline: inventory is easing, homes are taking a normal amount of time to sell, price cuts are common but shrinking, supply sits in balanced territory and is tightening, and rates are steady.
For sellers, that means strategy matters more than timing tricks. Pricing accurately from day one, preparing the home well, and marketing it for real exposure is what separates the homes that sell in weeks from the ones that sit. For move-up buyers, a balanced market is one of the few windows where you can negotiate on your purchase without giving everything away on your sale.
Understanding these five numbers, and where they stand in your specific neighborhood and price range, empowers you to act with confidence when they indicate you are in a good position to make a move.
Frequently Asked Questions About the Phoenix Housing Market
Is it a buyer's or seller's market in Phoenix right now?
Neither, in the classic sense. At roughly 3.4 months of supply, Greater Phoenix is a balanced market, and it has been tightening slightly as inventory falls and sales rise. Individual neighborhoods and price bands can lean one way or the other, which is why local numbers matter more than metro headlines.
Are home prices dropping in Phoenix?
Asking prices have been running about 2 to 3% below last year, but the pace of decline has been moderating for months, and median sale prices have been roughly flat to slightly positive. It reads more like a market finding its footing than one falling.
How long does it take to sell a house in Phoenix in 2026?
The metro median is about 64 days, essentially unchanged from last year. Well-priced, well-prepared homes routinely sell much faster than that, and overpriced homes account for much of the long tail.
Should I wait until next year to sell my Phoenix home?
It depends on your goals, your current rate, and your next move, not on a headline. With inventory down about 5% from last year and buyer activity rising, sellers who prepare and price correctly are seeing solid results now. The better question is what the numbers look like in your neighborhood and price range.
What are mortgage rates doing right now?
The average 30-year fixed rate is about 6.77% as of late July 2026, nearly identical to a year ago. Flat rates have given buyers time to adjust, which is part of why demand has been improving.
Thinking About Buying or Selling in the Phoenix Area?
If you want to know what these five numbers look like for your specific neighborhood, your price range, and your home, that is exactly what my team and I do. No pressure, just a clear picture of where you stand.
Book a strategy call with me and my team through the link in bio, or send me a message if you would like a custom market breakdown for your area. DM me your questions any time.
Caitlin McKeague, Associate Broker, Desert Dreamers Real Estate, brokered by Real. Serving Phoenix, Scottsdale, Paradise Valley, and the surrounding Valley.
Recent Posts







GET MORE INFORMATION

Broker Associate BRBR679010000