

Phoenix Housing Market Update, August 2026: Foreclosures, Prices, and What Comes Next
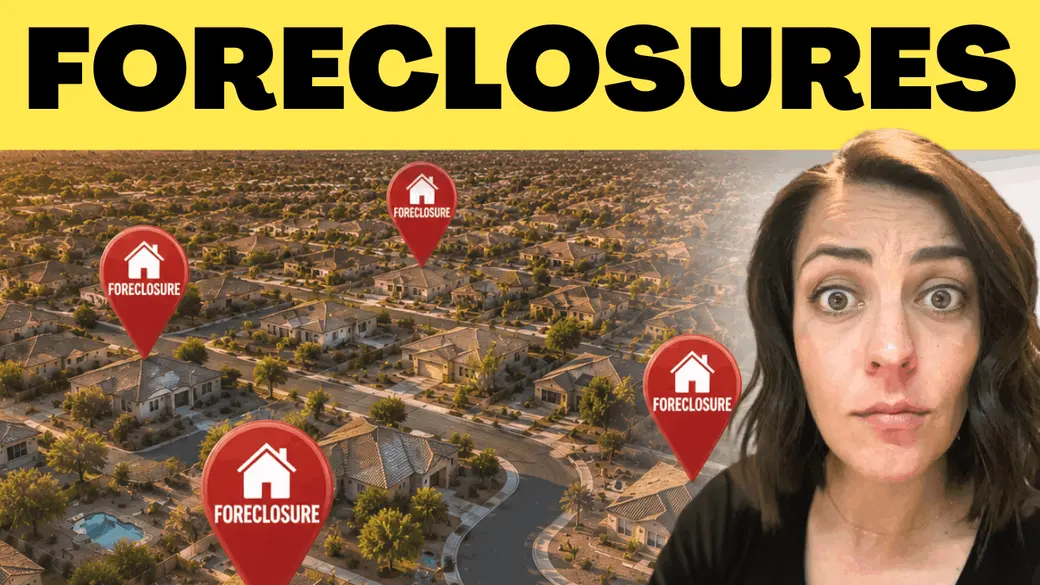
If you have seen headlines this month about a foreclosure wave, you are not imagining it. Foreclosure filings really are up 21% year over year nationally, and at the same time the Cromford Report is signaling that Phoenix prices are likely to get a little weaker over the next six to eight weeks.
So is a foreclosure crisis coming to Phoenix? Based on the data, no. Foreclosure activity is climbing back toward normal from unusually low pandemic-era levels, and the conditions that produced the 2008 crash are not the conditions we have today. The more useful local story is a quiet, seasonally slow summer market with a bit of price softness ahead. Here is the breakdown, and the video above walks through every chart.
Are foreclosures rising in Phoenix?
Yes, foreclosure activity is rising, but from a very low starting point, and Arizona is not among the hardest-hit states. The ATTOM report for June 2026 counted 39,327 properties nationally with default notices, scheduled auctions, or bank repossessions. That is up 21% from June 2025, and down 3% from May 2026.
The states with the highest foreclosure rates were Florida, South Carolina, Indiana, Nevada, and Illinois. Arizona ranks number 15, with one filing for every 3,620 housing units, or 882 filings out of 3,192,839 housing units statewide. Most of that activity sits in Pinal, Greenlee, La Paz, and Cochise counties, not Maricopa County where most of us live and work.
Closer to home, pending foreclosures in the Phoenix area are running roughly on pace with 2020. Notices of trustee sale have grown over the last couple of years, but they are nowhere near 2013 levels or earlier. Remember why 2020 was so low: forbearance programs were in place and homes were selling fast, so almost nobody who needed out of a mortgage had to go through foreclosure to do it. Comparing today to that stretch makes any increase look dramatic.
Why today does not look like 2008
Housing analyst Logan Mohtashami, who tracks this data daily for HousingWire, put it plainly: do not fall for a fake foreclosure crisis. Delinquencies remain within historical norms, homeowners hold a lot of equity, and most mortgages are fixed rate, which together limit forced selling. Four numbers make the case.
Inventory is nothing like the bubble. There are about 1.56 million active listings nationally today. In 2007 there were 4 million, and a normal market runs 2 to 2.5 million. We are still below normal, not flooded.
Homeowners have real equity. The loan-to-value ratio on U.S. mortgages sits at 45.1%. Loan-to-value is simply how much is owed compared to what the home is worth, so the average homeowner owns more than half their home outright. In 2013 that number was closer to 70%.
New listings would move first. A credit event shows up in new listings before it shows up in foreclosures, because the foreclosure process runs through 30, 60, 90, and 120 day notices before anything reaches the market. A normal seasonal peak is 80,000 to 100,000 new listings per week; 2026 is running around 74,000. During the bubble years it was 250,000 to 400,000 per week.
Payments are more manageable. Mortgage debt service as a share of disposable income is around 5.88% today, compared to roughly 8.95% in 2006.
Foreclosures and bankruptcies are still below pre-pandemic levels, and 1% to 4% of mortgage loans sit in some stage of delinquency in any given year. That is normal, and it is where we are heading back to.
What the Cromford Report expects for Phoenix prices
The Cromford Report anticipates prices getting weaker over the next six to eight weeks, with a likely rebound once the luxury segment contributes more to the mix from October onward. Their description of the current market is worth quoting: quiet and seasonally subdued rather than one under stress.
Luxury listings return to the Valley in the fall when the heat breaks and higher-end buyers come back from second homes, and that shift in the mix tends to pull reported price numbers back up. The caution is that weakness in pending and under-contract counts means we should not assume a strong autumn recovery.
Phoenix market snapshot
Phoenix metro, as of August 2026 (Cromford Report monthly summary):
- Active listings, excluding under contract and pending: about 24,000 in July 2026, versus about 24,000 in July 2025 and 24,500 in June 2026. Down 0.2% year over year, down 2% month over month.
- Pending listings: down 3.3% year over year, down 10% month over month.
- Listings under contract: down 3% year over year, down 12% month over month.
- Closed listings, average price per square foot, and median sales price: all up year over year.
- Listing success rate: down 5.4% year over year, down 14% month over month.
- List price to sale price ratio: slightly up. Days of inventory: slightly up, around 127 days.
- July closings: down 11.7% from June, or about 16% adjusted for 22 working days versus 21. Compared to July 2025, closings are up 3%.
- Cromford Market Index: 80 this week, with demand at 80 and supply at 99.3.
Two quick translations. Days of inventory means that if no new homes came on the market, it would take about 127 days for today's buyers to absorb everything for sale. Listing success rate is the share of listings that reach closing rather than expiring or being cancelled.
The honest read: active listings are essentially flat year over year, despite what you may have heard about inventory skyrocketing, and closings are still up 3% compared to last July. But contract activity has clearly slowed through the summer, and that slowdown is real.
What this means if you are buying
There is genuine opportunity here, and no reason to rush. Softer pricing over the next six to eight weeks, lighter competition, and sellers who have been sitting through a quiet summer all add up to more negotiating room than you would have had in the spring.
If you are shopping in the $600K to $1.3M range, pay attention to which submarket you are in, because conditions are not uniform across the Valley. New construction incentives are also still going strong, and builders in some communities are offering concessions worth comparing against resale.
What this means if you are selling
If selling this summer has felt slow, you are reading the market correctly. The listing success rate is down 5.4% year over year and 14% month over month, which tells us fewer listings are making it to the closing table.
That does not mean your home will not sell. It means presentation and pricing carry more weight right now than they did a year ago. Price it right from day one, make it show well, and plan for it to take a little longer. Plenty of sellers are choosing to cancel and wait out the heat, which is a valid choice, though the Cromford data suggests being measured about how much of a pickup fall will bring.
Which parts of the Valley favor buyers, and which favor sellers
The Cromford Market Index shows a clear split between the top and bottom of the price range: the most expensive areas are getting easier for sellers, while the least expensive are getting easier for buyers.
By that measure, cities from Mesa up through Paradise Valley are currently in seller's market territory. Gilbert, Avondale, Peoria, and Tempe are balanced. From Surprise down through Queen Creek, conditions currently favor buyers. Where your home sits on that map should shape your strategy either way.
Frequently asked questions about the Phoenix market
Is a foreclosure crisis coming to Phoenix in 2026?
The data does not support it. Filings are up 21% year over year nationally, but they remain below pre-pandemic levels, homeowner equity is high, and most mortgages are fixed rate. Arizona ranks 15th among states, with most activity outside Maricopa County.
Are home prices dropping in Phoenix right now?
The Cromford Report expects prices to soften over the next six to eight weeks. That said, median sales price and average price per square foot are both still up year over year, so this reads as seasonal cooling rather than a decline in value.
Is it a buyer's or seller's market in Phoenix?
It depends where you are. Mesa through Paradise Valley currently favors sellers. Gilbert, Avondale, Peoria, and Tempe are balanced. Surprise through Queen Creek currently favors buyers.
Is now a good time to buy a home in Phoenix?
If you are ready and the payment works for your budget, this is a reasonable window. Contract activity is down, competition is lighter, prices may soften slightly into early fall, and new construction incentives are still available in many communities.
How does Phoenix inventory compare to last year?
Almost identical. Active listings excluding under contract and pending sat at about 24,000 in July 2026, versus about 24,000 in July 2025, a change of just 0.2%. Reports of inventory skyrocketing in the Phoenix metro are not supported by the year-over-year numbers.
Thinking about buying or selling in the Phoenix area?
Whether the right move is this fall, next spring, or somewhere in between, the answer comes from your own numbers, not the headlines. Book a strategy call with me and my team and we will map out your options together, with zero pressure attached.
Prefer to start with numbers? Send me a message and I will put together a custom market breakdown for your area. You can also just DM me your questions, I answer them all.
Caitlin McKeague, Associate Broker, Desert Dreamers Real Estate, brokered by Real. Serving Phoenix, Scottsdale, Paradise Valley, and the surrounding Valley.
Recent Posts







GET MORE INFORMATION

Broker Associate BRBR679010000