

Phoenix Housing Market Update, July 2026: Most Affordable Zip Codes, Rates, and Price Trends
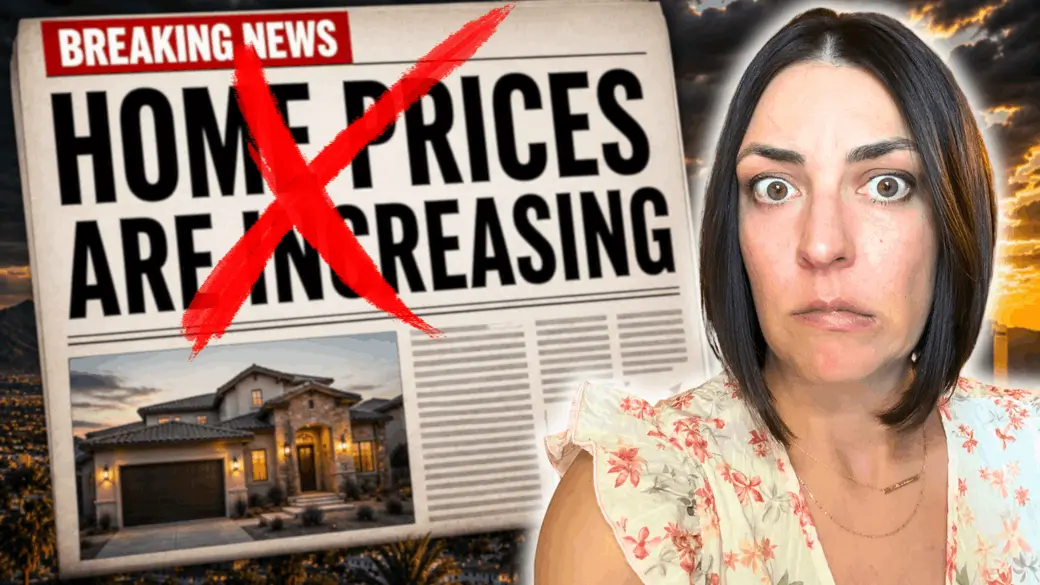
Welcome back to this week's Phoenix market update. A few weeks ago I ranked Valley zip codes by potential equity. This week I flipped the question and ranked them by affordability, using the lowest estimated monthly payment you can get on a median priced home. The results might surprise you: there are still zip codes in the Phoenix metro where that payment pencils out around $2,200 a month.
So is Phoenix getting more affordable? The data is quietly leaning that way. Wage growth is now outpacing home price growth nationally, Phoenix prices look likely to soften a bit over the next couple of months, and builders are offering some of the strongest new construction incentives we have seen in a while. Mortgage rates are the holdout, still sitting at 6.75%. Here is the full breakdown, and you can watch the full video above.
The most affordable zip codes in the Phoenix metro right now
The most affordable zip code in the Phoenix metro right now is 85009 in central west Phoenix, where the median priced home works out to an estimated payment of about $2,163 a month. I calculated these rankings using the median home value in each zip code, 10% down, a 30 year fixed mortgage at today's rates, and detached homes only, no condos or townhomes.
Here is how the list shakes out:
- 85009, Phoenix (central west, near I-17 and I-10): about $2,163 a month, median price $312,000
- Several central Phoenix zips just west of I-17: payments stay under $2,500 a month, with medians from $339,000 up to $370,000
- 85301, Glendale: about $2,543 a month
- 85043, southwest Phoenix: about $2,550 a month, median $371,000
- 85041, South Mountain area: about $2,641 a month, median $385,000
- 85345, Peoria: about $2,654 a month, median $387,000
- 85326, Buckeye: about $2,661 a month, median $388,000
- 85323, Avondale: about $2,809 a month, median $410,500
- 85353, Tolleson: about $2,825 a month, median $412,995
- 85201, Mesa: about $2,917 a month, median $427,000
- 85339, Laveen: about $3,199 a month, median $469,000
A few notes if you are comparing these areas. The South Mountain area gives you a better shot at newer construction than the Peoria zip code, even though the payments are nearly identical. Buckeye is a mix: the Verrado area leans new construction, while surrounding pockets offer homes with no HOA and more land. And remember, these are estimates based on medians and today's rates. Your actual payment depends on your down payment, your rate, and the specific home. I put together a custom home search of the detached homes available in these zip codes, so send me a message if you would like the link.
Affordability is quietly improving as wages catch up
Housing affordability is improving because wages are now growing faster than home prices. Housing analyst Logan Mohtashami highlighted that home prices are growing about 1.8% annually while wages are rising around 3.5%. Even though prices keep inching up, incomes are finally closing the gap. Redfin also reported that the income needed to afford a home declined for the seventh straight month in April. It may not feel like relief yet, but that is the direction the national numbers are pointing.
What is happening with Phoenix home prices
Phoenix prices are stable right now, with early signs of a seasonal dip ahead. The Cromford Report's mid month pricing update showed sales averaging $304.32 per square foot across all areas and types in the MLS, up 0.4% from $301.22 in mid June, though below the forecast midpoint of $307.78. The monthly median sales price sits at $451,000, down from $457,000 last month but up from about $446,000 a year ago.
The forward looking signal is the more interesting one. Pending listings, meaning homes under contract but not yet closed, show an average list price of $317.91 per square foot, down 1.3% from June. When pending prices come in lower, closed prices usually follow over the next month or so. A third quarter dip is normal seasonally in Phoenix, so this is not alarming, just worth watching.
One more thing to note: among pending listings, 96.1% are normal sales, with small shares of lender owned homes and pre-foreclosures. Distress levels are still low compared to the average of the last 25 years, but the Cromford Report flagged a distinct upward trend in pre-foreclosure activity. For anyone hoping for a wave of deals, this is one data point, not a trend to count on, but it is something to keep an eye on.
Mortgage rates are not budging
The 30 year fixed rate is at 6.75% right now, up from 6.63% at the end of last week. We spent a while hovering around six and a half, and rates have now stayed consistently above that mark. For context, last year rates slid from 6.75% at the end of July down to 5.99%, but that progress reversed in early 2026 and rates have stayed elevated since.
If you are weighing affordability, your rate matters as much as the price. Connect with a mortgage lender to get a real read on your numbers before you rule anything in or out.
New construction: the discounts are real
If you want a discount in this market, new construction is the clearest place to find one. Builder confidence fell two points to 34 in July, the index tracking current sales conditions slid to 37, and the six month sales expectations index dropped to 43. Translation: builders are not feeling confident about sales, so they are offering incentives and discounts to move homes. Lennar has even been lowering base prices on top of incentives. New construction is not for everyone, but if it fits your plans, the current incentive environment works in your favor. I put together a list of the best new construction incentives around the Valley, so reach out if you want it.
Is it a buyer's or seller's market in Phoenix?
Overall, the Valley is slightly balanced to buyer leaning right now, but it truly depends on the city. The Cromford Market Index, which measures the balance between supply and demand (100 is a balanced market), sits at 80.5, with demand at 81.4 and supply at 101.1.
Two things stand out. Demand is only about 19% below normal, so buyers are still active, it is just summer and things naturally slow down in the heat. And supply is falling: we have fewer active listings than we did last summer, the first time in several years the active count has dropped below the prior year. Fewer listings usually means more competition in certain areas.
City by city, Mesa up through Fountain Hills are still seller's markets, Goodyear down through Queen Creek are buyer's markets, and Tempe, Peoria, Avondale, and Gilbert are balanced. The average month over month change is down 1.3%, unchanged from last week. Stable and a little boring, which after the last few years is something we can appreciate.
Phoenix market snapshot (as of July 2026):
- 30 year fixed mortgage rates around 6.75%, up from 6.63% the prior week
- Average sales price of $304.32 per square foot, up 0.4% from mid June (Cromford Report)
- Monthly median sales price of $451,000, down from $457,000 last month, up from about $446,000 a year ago
- Pending listings averaging $317.91 per square foot on list price, down 1.3% from June
- Cromford Market Index at 80.5 (demand 81.4, supply 101.1)
- Most affordable zip code: 85009, at roughly $2,163 a month on a $312,000 median price
Put together, this reads as a healthy but cooling summer market. Prices are holding near their highs while the forward indicators point to some softening, and lower supply keeps things from tipping too far in any one direction. Strategy matters more than timing the exact bottom.
What this means if you are buying
Affordability is trending in your favor on several fronts: wages outpacing price growth, likely price softening over the next couple of months, and real new construction discounts. If your timeline is flexible, keep December in mind. Deals negotiated in December tend to close at the lowest recorded prices in January, so buying late in the year is genuinely not a bad move. In the meantime, get clear on your payment with a lender at today's rates so you can act with confidence when the right home shows up.
What this means if you are selling
If you want to catch the fall market before the holiday slowdown, plan to be on the market in September. Activity typically picks up in September and October, then tapers through November and December. With pending prices trending slightly lower, pricing correctly from day one matters more than ever. The closed sales happening now become the comparables buyers and appraisers use next month, so overpricing and chasing the market down is the expensive path. Strong marketing and strategic pricing beat wishful pricing in a market like this.
Frequently asked questions about the Phoenix housing market
What are the most affordable zip codes in Phoenix?
Based on estimated monthly payments for median priced detached homes, the most affordable zip codes right now are 85009 in central west Phoenix (about $2,163 a month), followed by several central Phoenix zips west of I-17, then Glendale 85301, southwest Phoenix 85043, South Mountain 85041, Peoria 85345, and Buckeye 85326, all under roughly $2,700 a month.
Are home prices dropping in Phoenix?
Not dramatically, but a modest seasonal dip looks likely. The median sales price is $451,000, down from $457,000 last month but still up from about $446,000 a year ago. Pending listing prices are down 1.3% from June, which suggests closed prices may ease over the next month or two, consistent with the usual third quarter pattern.
Is it a buyer's or seller's market in Phoenix right now?
It depends on the city. The Valley-wide Cromford Market Index is 80.5, which leans buyer friendly overall. Mesa through Fountain Hills still favor sellers, Goodyear through Queen Creek favor buyers, and Tempe, Peoria, Avondale, and Gilbert are balanced.
What are mortgage rates doing in July 2026?
The 30 year fixed rate is around 6.75%, up from 6.63% the week before. Rates hovered near six and a half for a stretch this year and have stayed above that level recently, so it is worth talking with a lender about what your actual payment looks like today.
When is the best time to buy a house in Phoenix?
There is no single right answer, but December buyers often negotiate the lowest prices, which show up in January closing data. Fall also brings a pickup in activity and fresh inventory in September and October. The best timing is the one that fits your budget and your life, and that is exactly what a strategy conversation is for.
Thinking about buying or selling in the Phoenix area?
Whether you are eyeing one of these affordable zip codes, weighing new construction incentives, or planning a fall listing, you do not have to figure it out alone. Book a strategy call with me and my team, and we will walk through your options with real numbers, no pressure. Prefer to start with data? Send me a message for a custom market breakdown, the affordable zip code home search, or the new construction incentives list.
Caitlin McKeague, Associate Broker, Desert Dreamers Real Estate, brokered by Real. Serving Phoenix, Scottsdale, Paradise Valley, and the surrounding Valley.
Recent Posts







GET MORE INFORMATION

Broker Associate BRBR679010000